Job Metrics
Right-size runners and spot job-level resource constraints in GitHub Actions
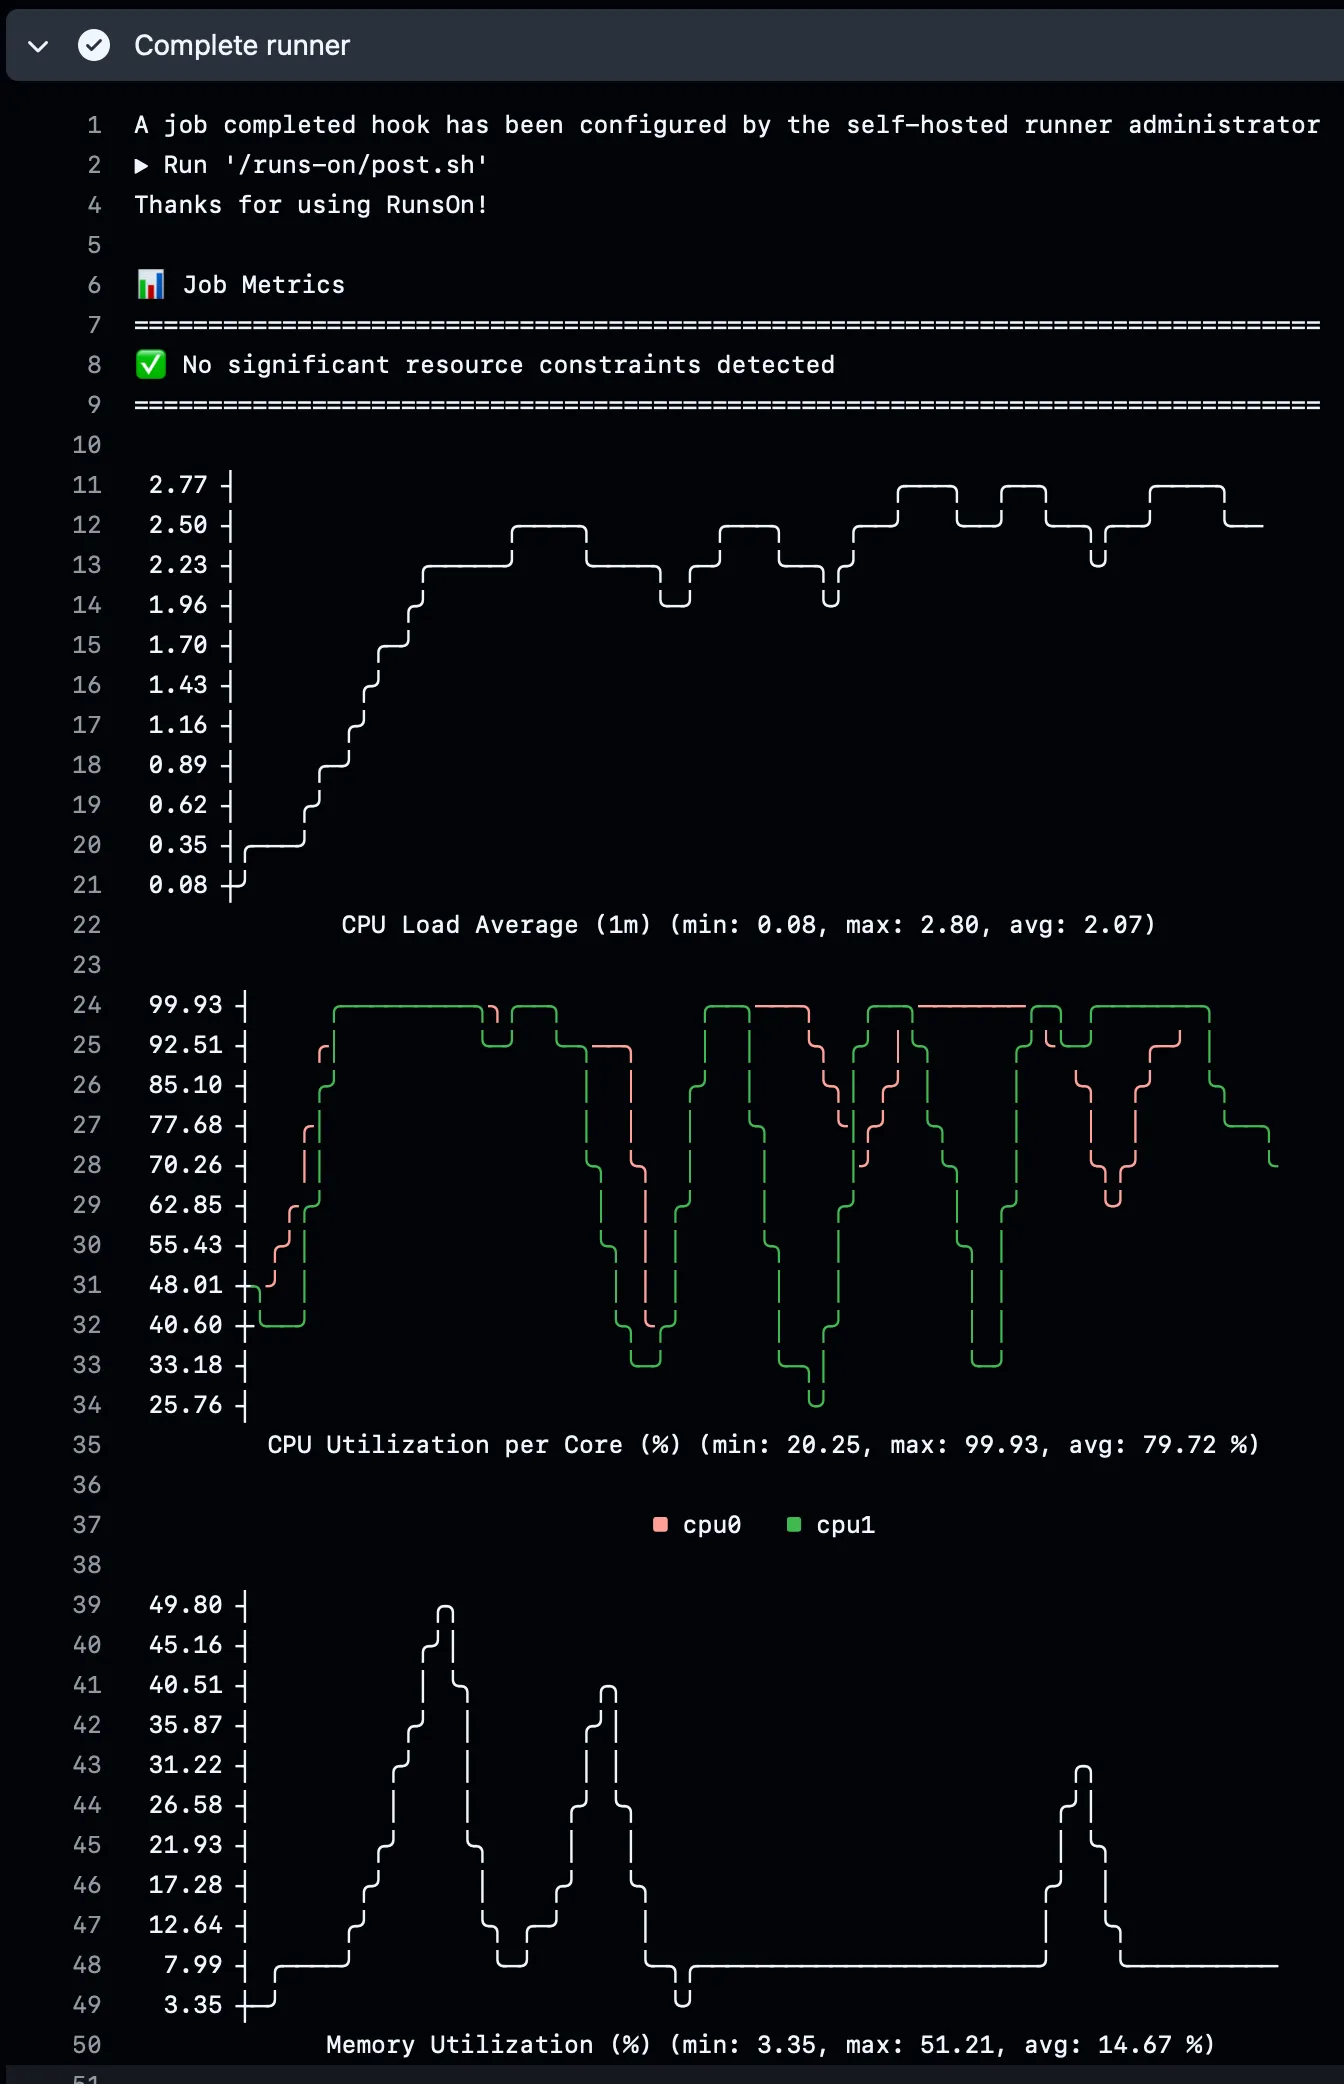
RunsOn puts per-job ASCII charts directly in GitHub Actions, so you can right-size runners and spot CPU, memory, disk, or network constraints without leaving the job UI. There are two ways these charts can appear, and they show up in different steps.
Two variants
| Variant | Where it appears | Data source | Raw file | Best for |
|---|---|---|---|---|
| Built-in runner metrics | Complete runner | Local RunsOn collector on the runner | Writes and uploads metrics.jsonl | Default right-sizing and single-job troubleshooting |
runs-on/action@v2 metrics | Post Run runs-on/action@v2 | CloudWatch agent plus action post-step queries | No metrics.jsonl file | Explicit action-driven metrics collection through CloudWatch |
Built-in runner metrics
This is the default path on current RunsOn runners.
- The runner collects local host metrics during the job.
- RunsOn writes those samples into
metrics.jsonlon the runner. - The
Complete runnerstep renders ASCII charts from that file. - The same step uploads
metrics.jsonlinto your RunsOn S3 bucket for later inspection.
This flow is separate from remote OTLP export. You can get the Complete runner charts and the uploaded metrics.jsonl file without enabling runs-on/action@v2.
Example excerpt from a real Complete runner step:
Action-based metrics with runs-on/action@v2
The action path is different.
- You add
runs-on/action@v2↗ to the job. - You request one or more metric groups with the
metrics:input. - The action configures CloudWatch metrics collection.
- In
Post Run runs-on/action@v2, the action queries CloudWatch and renders ASCII charts in that post step.
This path does not generate or upload metrics.jsonl.
Note that this action-based metrics flow does not work with container-based jobs, unlike the built-in runner metrics path.
Supported action metric groups
| Metric group | Available metrics | What it helps you answer |
|---|---|---|
| CPU | usage_user, usage_system | Is the runner CPU-bound? |
| Network | bytes_recv, bytes_sent | Is the job moving a lot of data? |
| Memory | used_percent | Is the runner memory-constrained? |
| Disk | used_percent, inodes_used | Is the workspace or filesystem filling up? |
| I/O | io_time, reads, writes | Is the job bottlenecked on disk activity? |
Configure the action variant
Add the action and request the metric groups you want:
jobs:
  build:
    runs-on: runs-on=${{ github.run_id }}/runner=2cpu-linux-x64
    steps:
      - uses: runs-on/action@v2
        with:
          metrics: cpu,network,memory,disk,io

      - uses: actions/checkout@v6
      - name: Build application
        run: npm run build
You can also request a smaller subset:
- uses: runs-on/action@v2
  with:
    metrics: cpu,memory
Existing example output from the action post step:
📈 Metrics (since 2025-06-30T14:18:56Z):

📊 CPU User:
   100.0 ┤
    87.5 ┤                                        ╭─╮╭───────────╮
    75.0 ┤                                       ╭╯ ╰╯           │
    62.5 ┤                                      ╭╯               ╰╮
    50.0 ┤                                      │                 │
    37.5 ┤                                      │                 ╰╮
    25.0 ┤                                     ╭╯                  │
    12.5 ┤                    ╭─────────╮╭─────╯                   ╰╮
     0.0 ┼────────────────────╯         ╰╯                          ╰
                               CPU User (Percent)
  Stats: min:0.0 avg:29.0 max:93.4 Percent
Which one to use
- Use the built-in runner metrics flow when you want the default RunsOn experience:
Complete runnercharts plus uploadedmetrics.jsonl. - Use
runs-on/action@v2when you specifically want the older action-driven CloudWatch metrics path and explicit metric-group selection. - Use both only if you intentionally want both step outputs in the same job.
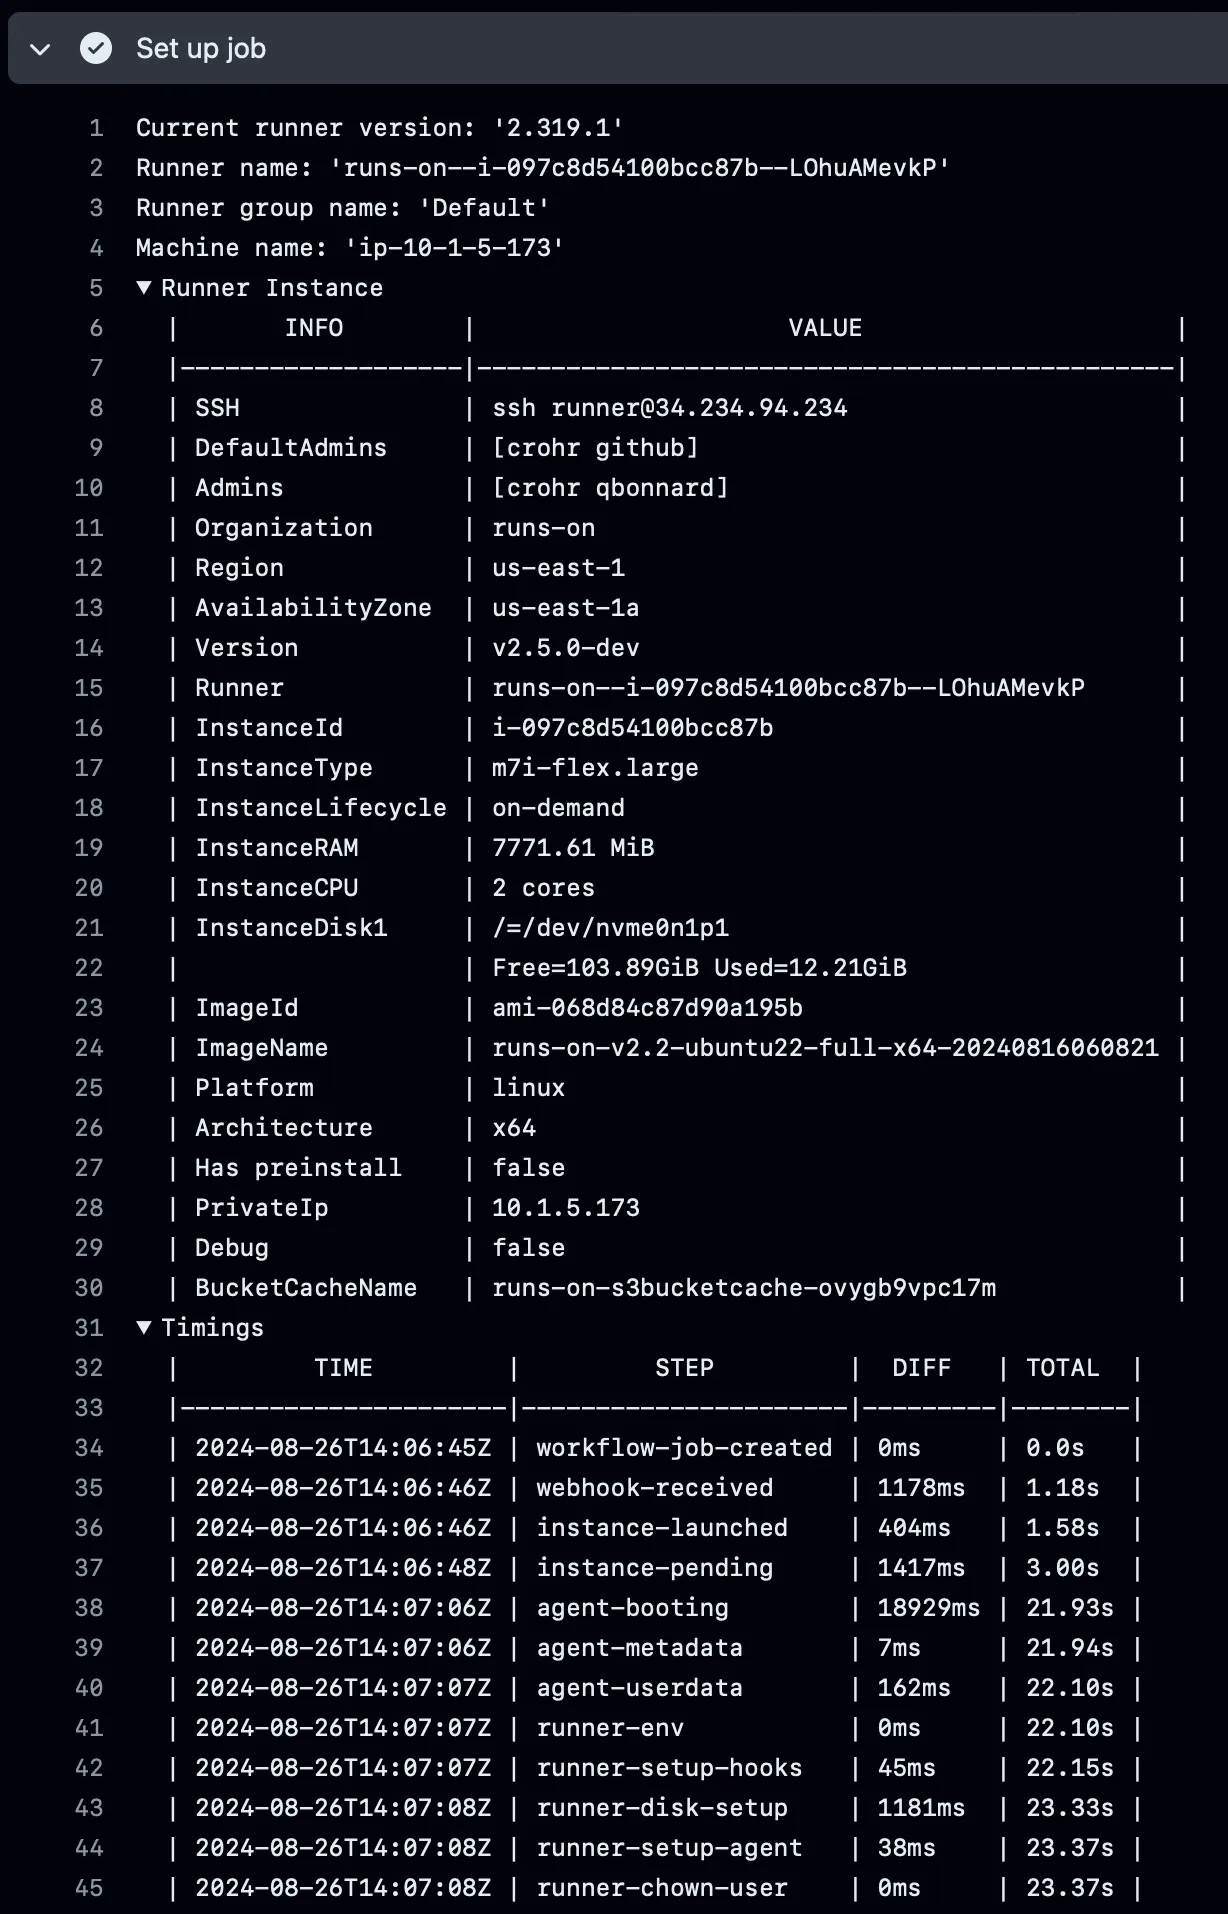
Metadata
For each runner, you will also find detailed metadata about the EC2 instance, RunsOn installation, and runner timings. This is available when you expand the “Set up job” section in the GitHub Actions UI:
OTLP separation
Neither of these per-job ASCII metrics flows automatically sends the charts themselves to your OTEL backend.
- The built-in runner metrics flow uses the local collector and
metrics.jsonlfile for inline output. - Remote runner OTLP export is a separate concern controlled by stack OTLP settings plus runner OTEL enablement. See OpenTelemetry for the exact remote metrics, logs, and traces behavior.