Troubleshoot
Troubleshoot your RunsOn installation
Runners can fail to start for a variety of reasons. If an error is raised while attempting to start a workflow, RunsOn will alert you by email (assuming you have confirmed the SNS Topic notification when you setup the stack).
Quick checks
- https://www.githubstatus.com ↗ - see if GitHub Action is having issues.
- you are using the latest version.
Common symptoms
Contact support
Once you’ve made the checks above, please have a look below at various error cases, and send us an email if the issue persists: ops@runs-on.com. Include as many details as possible, such as:
- RunsOn version.
- AWS region.
- Any error messages you see in the GitHub UI, email notifications, or CloudWatch logs.
- CloudWatch logs for the RunsOn control plane (you can filter on the
run_idorjob_id), and instance logs if you have them. - Details about the workflows in error, especially the
runs-onlabels, number of jobs in the workflow, and any use of matrix jobs.
How to find run_id and job_id
The run_id and job_id are not easily available from the GitHub UI. The easiest way is to go to a job log outputs in the GitHub UI, and extract the values from the URL.
For instance you may have a URL that looks like this:
https://github.com/YOUR_ORG/YOUR_REPO/actions/runs/12054210358/job/33611707460In which case the run_id is 12054210358 and the job_id is 33611707460.
CloudFormation stack fails while creating RunsOnWorkerCluster
If the CloudFormation stack fails on RunsOnWorkerCluster with the following error, the failure happens before RunsOn starts:
Unable to assume the service linked role. Please verify that the ECS service linked role exists.RunsOnWorkerCluster is the ECS/Fargate cluster used by the RunsOn control plane. AWS needs the account-level ECS service-linked role, AWSServiceRoleForECS, before it can create or use that cluster.
This can happen in fresh AWS Control Tower or multi-account environments when the member account does not have the ECS service-linked role yet, or when an SCP or permission boundary blocks ECS from creating or assuming it.
First check whether the role exists in the target AWS account:
aws iam get-role --role-name AWSServiceRoleForECSIf the role is missing, create it once:
aws iam create-service-linked-role --aws-service-name ecs.amazonaws.comIf that command is denied, your AWS Organizations policy or permission boundary must allow service-linked role creation for ECS. A scoped allowance looks like this:
{
  "Effect": "Allow",
  "Action": "iam:CreateServiceLinkedRole",
  "Resource": "*",
  "Condition": {
    "StringEquals": {
      "iam:AWSServiceName": "ecs.amazonaws.com"
    }
  }
}
After the role exists and IAM propagation has completed, retry the CloudFormation stack creation.
All jobs are queued indefinitely or long queuing time for some workflows
RunsOn runners consistently start in ~30s for x64 and arm64. If you are seeing abnormal queuing times, let’s review the different possible root causes.
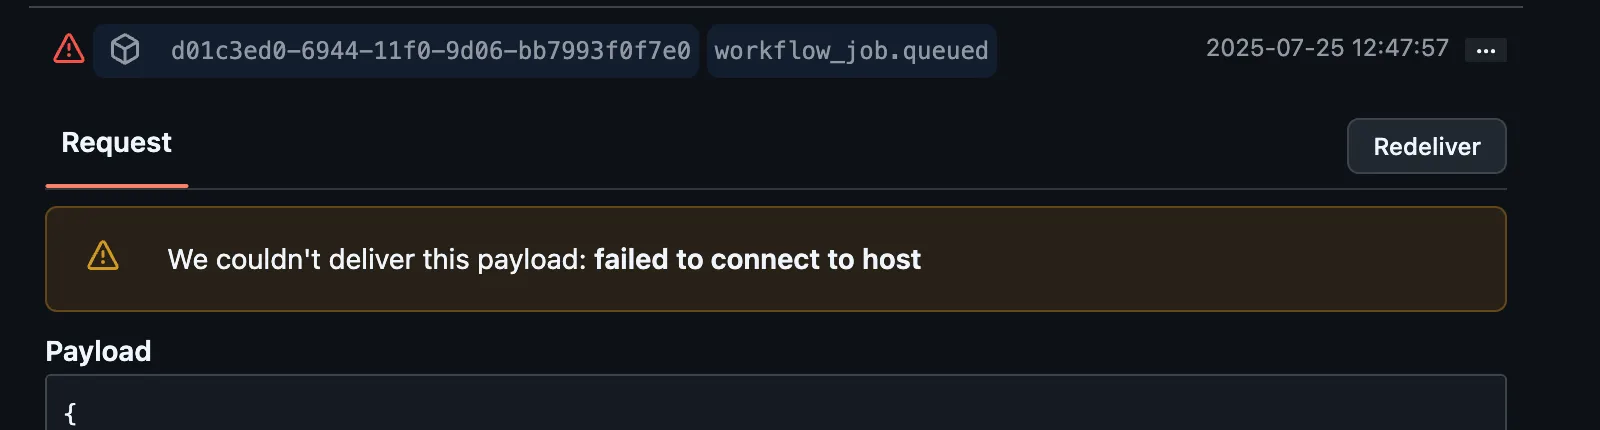
Webhooks not getting delivered
To start a runner, the GitHub webhook needs to be delivered to the RunsOn public ingress endpoint. If you are seeing long queuing times, it is possible that the webhook is not getting delivered.
To check this, you can go to your RunsOn GitHub App settings > Advanced, and you should see the last deliveries with their status code.
If you see a non-200 status code, it is possible that the webhook is not getting delivered. You can manually trigger a delivery. If it persists and you think it might be a bug on the receiver side, please contact support.
Runner stealing
It may be the case that the runner started for your workflow job has been stolen by another workflow job.
For instance, if two workflow jobs A and B with the same runs-on labels are queued at the same time, the runner started for job A may actually start processing job B (since runner A labels matches those for job B), while job A has to wait for runner B to come up online.
To avoid this and help with debugging, it is best practice to ensure that each workflow job gets a more unique label. This can be achieved by assigning the current workflow run id as an additional label.
Make sure you are using the single-string syntax available since v2.5.4, so GitHub treats the full RunsOn specification as one label:
jobs:
  my-build-job:
    runs-on: "runs-on=${{ github.run_id }}/runner=2cpu-linux-x64"
    # even better, if you have multiple jobs in the same workflow file with the same `runs-on:` labels
    runs-on: "runs-on=${{ github.run_id }}-my-build-job/runner=2cpu-linux-x64"

  my-release-job:
    runs-on: "runs-on=${{ github.run_id }}-my-release-job/runner=2cpu-linux-x64"
If the problem persists:
- ensure that the repository is correctly enabled for your RunsOn GitHub App.
- ensure that webhooks are correctly delivered to your RunsOn public ingress endpoint: go to your RunsOn GitHub App settings > Advanced, and you should see the last deliveries with their status code.
If you need more help, please contact support (see above for links).
Runner stealing and matrix jobs
If you are using matrix jobs, note that the github.run_id is not unique for each matrix job. It is only unique for each workflow run, and unfortunately GitHub still doesn’t expose the JOB_ID variable for a job. So if you want to ensure a deterministic job <-> runner assignment, you can append the strategy job index ↗ in addition to the workflow run id. You can also add the run attempt number ↗ for good measure:
jobs:
  my-build-job:
    strategy:
      matrix:
        node: [16, 18, 20]
    runs-on: "runs-on=${{ github.run_id }}-my-build-job-${{ strategy.job-index }}/runner=2cpu-linux-x64"
    # or even more complete, although... long
runs-on: "runs-on=${{ github.run_id }}-my-build-job-${{ github.run_attempt }}-${{ strategy.job-index }}/runner=2cpu-linux-x64"Viewing logs
Application logs
Application logs for the RunsOn control plane are available in CloudWatch. The log group name is exposed by the CloudFormation RunsOnServiceLogGroupName output.
There are multiple ways to access the logs:
For v3 and later, RunsOn provides a CLI --full mode to export a complete diagnostic archive for a GitHub job:
AWS_PROFILE=your-aws-profile roc logs https://github.com/YOUR_ORG/YOUR_REPO/actions/runs/RUN_ID/job/JOB_ID --fullThis writes a roc-logs-<job_id>-<timestamp>.zip archive with the raw workflow-job item, RunsOn control-plane logs for the job and run, CloudTrail events for attempted instances, EC2 console output, and agent logs.
For live streaming, omit --full:
AWS_PROFILE=your-aws-profile roc logs https://github.com/YOUR_ORG/YOUR_REPO/actions/runs/RUN_ID/job/JOB_ID --watchIt can be useful to access the logs of RunsOn to see more details about the issues. This can either be done from CloudWatch UI, or with awslogs command:
pip install awslogsNow replace the log group with the value of your RunsOnServiceLogGroupName stack output, and you can do:
AWS_PROFILE=your-aws-profile awslogs get --aws-region eu-west-1 \
  YOUR_RUNS_ON_SERVICE_LOG_GROUP_NAME \
  -wGS -s 30m --timestamp
You can also find the logs from the AWS UI, and apply filtering based on e.g. the workflow run id:
On current v3 CloudFormation installs, application logs use the built-in retention configured by RunsOn. If you manage the stack yourself with Terraform/OpenTofu or custom infrastructure, verify that your CloudWatch log retention matches your own policy.
Instance cloud-init logs
Official images publish bootstrap logs, including the cloud-init boot process, to the EC2 instance log group in CloudWatch.
If runner OTEL is enabled for a job, the bootstrap output.log file can also be forwarded to your OTLP backend as described on /monitoring/opentelemetry/.
You can use the RunsOn CLI to view all job logs:
roc logs https://github.com/owner/repo/actions/runs/123/job/456These logs can be also be retrieved from the AWS UI: CloudWatch > Log groups > <STACK_NAME>-runs-on-EC2InstanceLogGroup-<RANDOM_ID>.
Within that log group you will find a log stream for each instance and accompanying log file (e.g. i-0006f3ff78fcd11f4/cloud-init-output). You can filter using the instance ID.
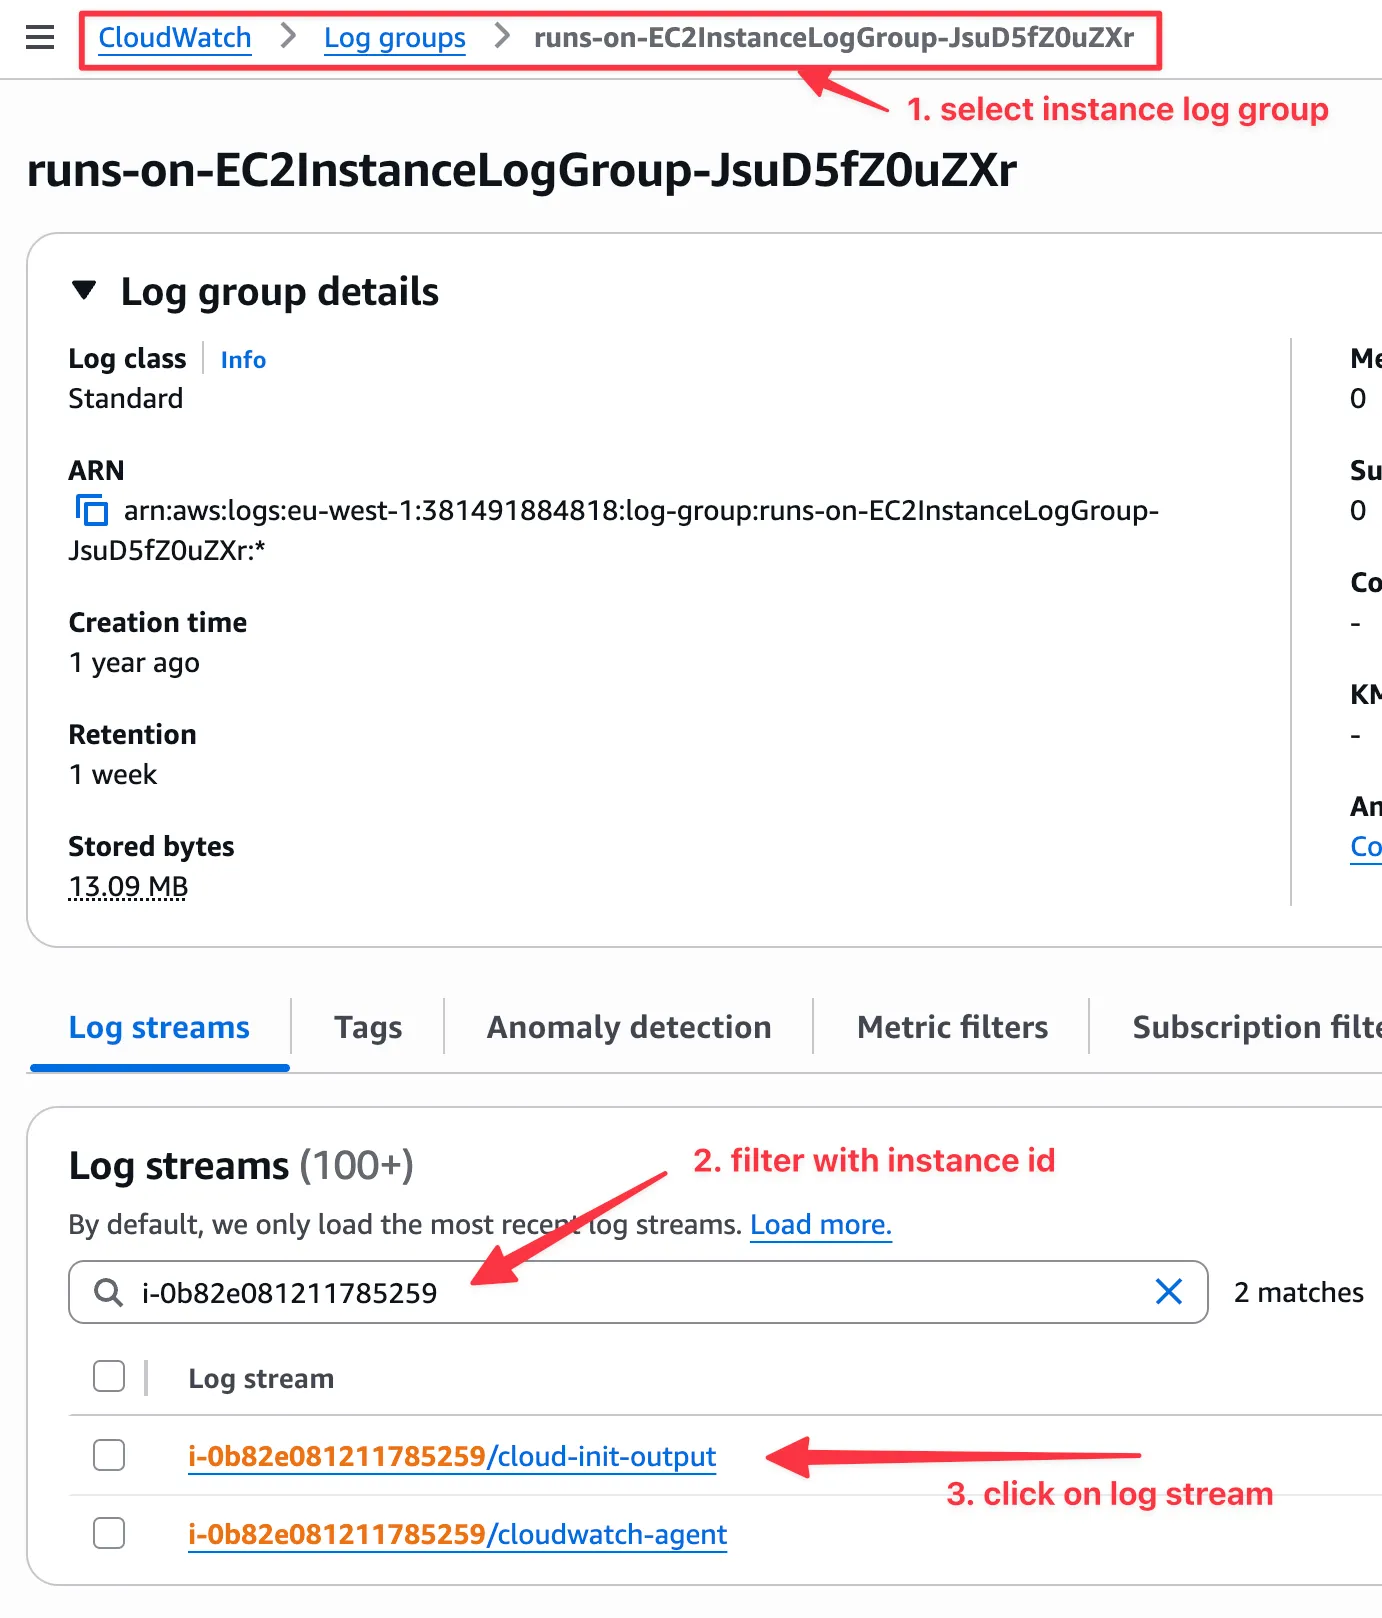
Instance logs are kept for 7 days.
Instance console logs
You can use the RunsOn CLI to view the EC2 instance console logs:
roc logs https://github.com/owner/repo/actions/runs/123/job/456 --include=consoleYou can also retrieve the console logs through the AWS Console. In EC2, select your instance and then Actions > Monitor and troubleshoot > Get system log:
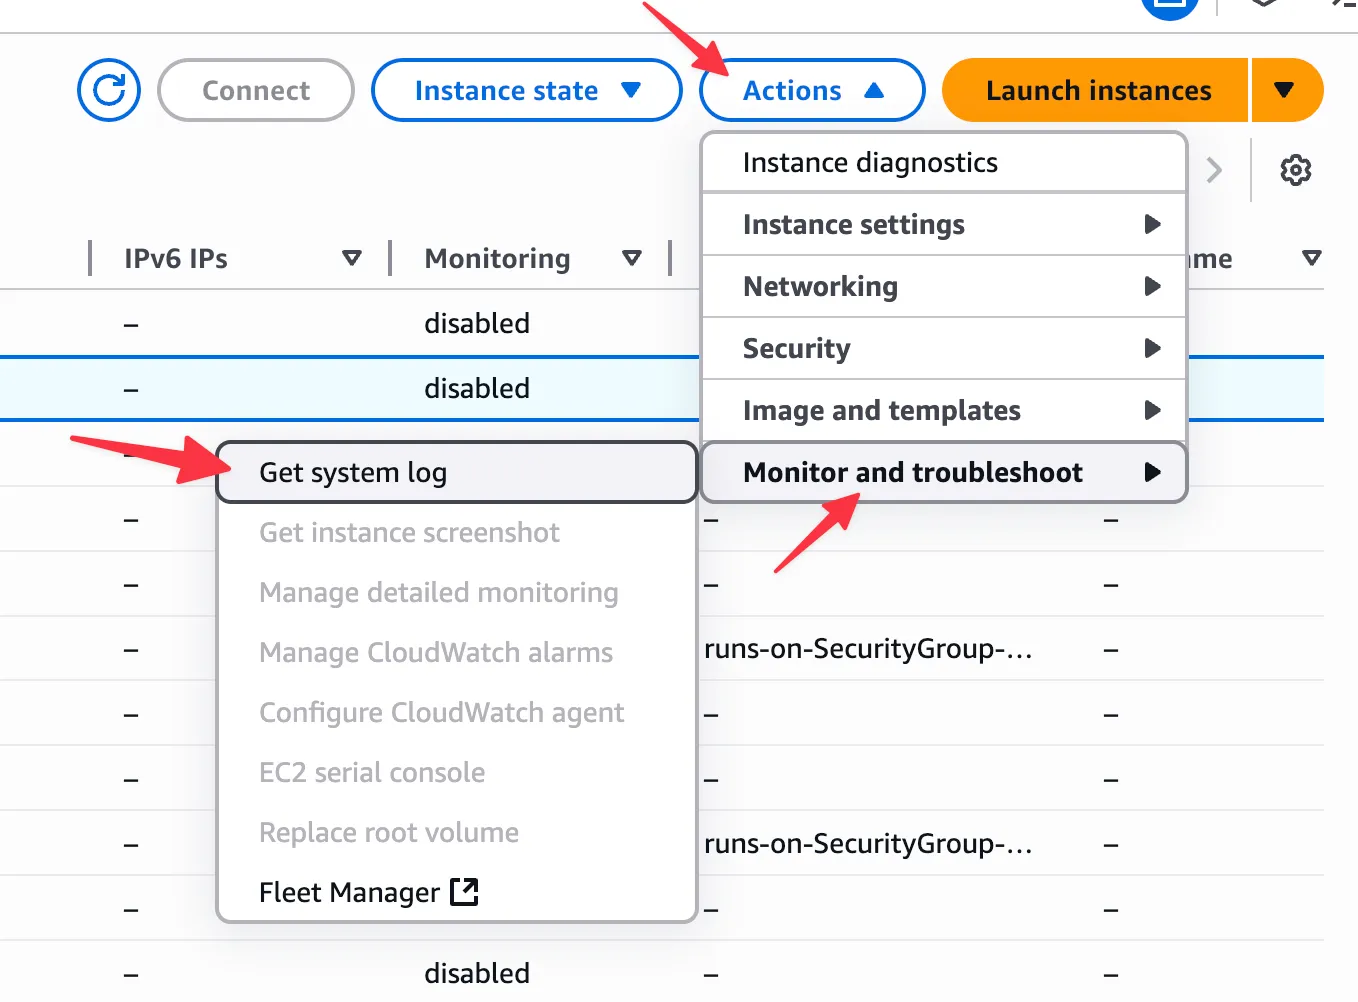
Note that system logs are sometimes only available a few minutes after the instance has been created.
View Cloudtrail events
If you’re getting errors about request limit exceeded or quota issues, have a look at the Cloudtrail events, and especially for the RunInstances API event, to see if you are getting rate limited.
For instance in eu-west-1, the Cloudtrail events can be accessed at:
https://eu-west-1.console.aws.amazon.com/cloudtrailv2/home?region=eu-west-1#/events?ReadOnly=falseChecking if a spot instance has been preempted
In the CloudTrail events, you can check if a spot instance has been preempted by checking for events with the name BidEvictedEvent.
Failed to create instance
This error can happen due to multiple reasons:
PendingVerification
⚠️ Failed to create instance with type c7a.4xlarge: PendingVerification: Your request for accessing resources in this region is being validated, and you will not be able to launch additional resources in this region until the validation is complete. We will notify you by email once your request has been validated. While normally resolved within minutes, please allow up to 4 hours for this process to complete. If the issue still persists, then open a support case. [https://support.console.aws.amazon.com/support/home?region=us-east-1#/case/create?issueType=customer-service&serviceCode=account-management&categoryCode=account-verification]This is usually resolved within a few minutes (automatically). So just retry the workflow a few minutes later and it should work. Otherwise open a support case.
RequestLimitExceeded
This usually happens if you are launching instances too quickly compared to the allowed rate limit for your account.
The rate limit mechanism is detailed in https://docs.aws.amazon.com/AWSEC2/latest/APIReference/throttling.html ↗.
RunsOn now defaults to the lowest rate limit (2 RunInstances API call/s max).
If your account has a higher quota for those API calls, you can use a larger AppSize preset. Larger presets increase worker concurrency and assume you have raised the relevant EC2 quotas.
Unexpected costs
AWS Config
If you have AWS Config enabled in your AWS account, with the default settings it will record an event for every resource created in your account, including every EC2 instances created by RunsOn. Each EC2 instance will trigger at least 3 events that could quickly add up:
AWS EC2 FleetAWS EC2 Network InterfaceAWS EC2 Volume
To avoid this, you should modify your AWS Config settings to skip recording for those events, in the AWS account where RunsOn is deployed.
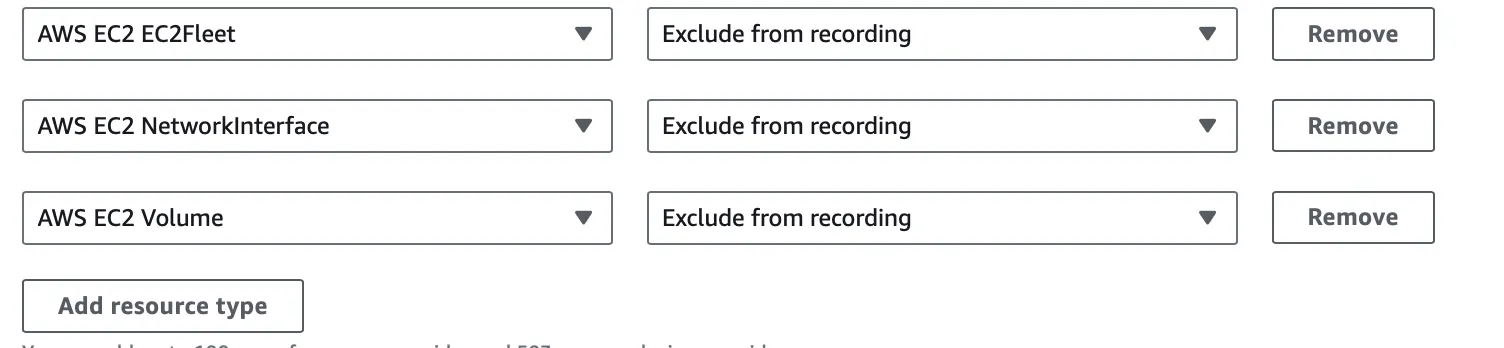
You can also skip recording AWS EC2 Instance events if you have really high usage.
Datadog
From one of our users ↗:
We ran into a big spike in registered Datadog Infra Hosts after switching to RunsOn because Datadog’s automatic AWS integration was picking up the new instances. And of course, since this is Datadog, more hosts means a lot more money. https://docs.datadoghq.com/account_management/billing/aws/#aws-resource-exclusion ↗ gives an easy approach to ignoring these hosts, I’m just doing
EC2: !provider:runs-on.comand that seems to be working.
apt and dpkg lock errors
If you encounter apt or dpkg lock errors like the following during your workflow jobs:
E: Could not get lock /var/lib/apt/lists/lock. It is held by process 1166 (python)
E: Unable to lock directory /var/lib/apt/lists/
or:
Run sudo apt-get update -qq && sudo apt-get install build-essential -y
E: Could not get lock /var/lib/dpkg/lock-frontend. It is held by process 1674 (dpkg)
E: Unable to acquire the dpkg frontend lock (/var/lib/dpkg/lock-frontend), is another process using it?
Error: Process completed with exit code 100.
the most likely cause is that AWS is upgrading the SSM Agent in the background while your job is trying to run apt.
If you followed the recommended RunsOn setup and use a dedicated AWS account for RunsOn, disabling SSM Agent auto-updates is usually the right fix. RunsOn instances are short-lived, so letting AWS update SSM Agent in the background adds little value and can break package installation during job startup.
To fix this, disable SSM Agent auto-updates in your AWS account:
- Go to the AWS Systems Manager console ↗.
- Navigate to Fleet Manager > Settings.
- Under Agent auto update, choose Delete to remove the State Manager association that automatically updates SSM Agent on your managed nodes.
See the AWS documentation ↗ for more details.
Alternatively, you can work around this issue by:
- Adding a retry with backoff to your
apt installcommands. - Pre-installing the required packages in a custom image.
Useful log filters
Below are some useful log filters that can be used to filter the logs in the CloudWatch console to look for specific events.
Spot interruption events
EC2 Spot Instance Interruption Warning: appears when a Spot Instance is preempted.
Instance state changes
EC2 Instance State-change Notification: appears when an instance changes state.
{"level":"info","app_environment":"dev","app_stack_name":"runs-on","app_version":"v2.6.7-dev","event":{"version":"0","id":"40473256-175b-1dda-ce12-a89033da938a","detail-type":"EC2 Instance State-change Notification","source":"aws.ec2","account":"756351362063","time":"2025-02-14T15:56:59Z","region":"us-east-1","resources":["arn:aws:ec2:us-east-1:756351362063:instance/i-098becb5aa9dbf323"],"detail":{"instance-id":"i-098becb5aa9dbf323","state":"running"}},"time":"2025-02-14T16:56:59+01:00","message":"🗒️ Processing event"}Rate limiters
Current tokens: outputs the tokens remaining in each rate limit bucket.
{"level":"info","app_environment":"dev","app_stack_name":"runs-on","app_version":"v2.6.7-dev","time":"2025-02-14T16:39:17+01:00","message":"Current tokens remaining/used/limit for GitHub: 4395/605/5000, Self-Hosted Runners: 10000/0/10000. Next reset at 2025-02-14 16:55:25 (in 967.15 seconds, 4.54 tokens/s)"}
{"level":"info","app_environment":"dev","app_stack_name":"runs-on","app_version":"v2.6.7-dev","time":"2025-02-14T16:39:17+01:00","message":"Current tokens remaining for limiters: githubLimiter=tokens:0.00,burst:4395 ec2ReadLimiter=tokens:100.00,burst:100 ec2RunLimiter=tokens:5.00,burst:5 ec2TerminateLimiter=tokens:5.00,burst:5 ec2MutatingLimiter=tokens:50.00,burst:50"}
Notes:
- the Self-Hosted Runners rate limit is supposed go down, but GitHub currently doesn’t enforce (nor counts) it. So the GitHub API currently always returns 10000 remaining tokens.
- contrary to EC2, the GitHub rate limit is only refillable every hour. So once it goes down to zero, you will have to wait until the next hour to be able to run workflows again. RunsOn attempts to avoid this as much as possible and you should not hit the limit if you run up to 2000 jobs per hour (or 6000 jobs per hour on GitHub Enterprise plan).